How do I keep chart values after SVG to PNG?
Export the chart as a PNG, but keep its underlying numbers in a separate text table beside the image. State the main takeaway in a short sentence, give the image a concise alt description, and compare the table with the source data before publishing. Neither the SVG-to-PNG conversion nor a larger export recovers exact values that were never recorded.
Convert an SVG chart to PNGExample: a chart and its numbers
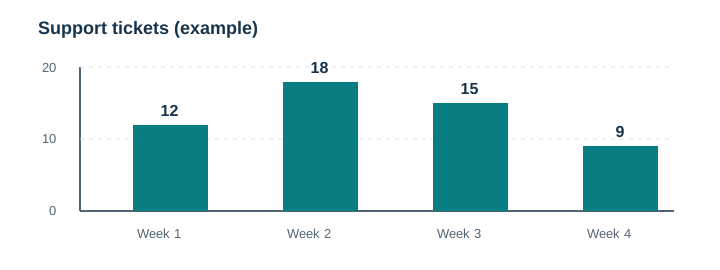
This is a made-up support-ticket example, not traffic or performance data for this website. The four bars use the same values as the table. In the chart source, each bar is labeled; the table remains readable even when the graphic is unavailable.
| Week | Tickets |
|---|---|
| 1 | 12 |
| 2 | 18 |
| 3 | 15 |
| 4 | 9 |
Takeaway: the count rises from Week 1 to Week 2, then falls in Weeks 3 and 4. The chart is a visual overview; the table carries the exact values.
A repeatable export checklist
- Save the source dataset with its units, category labels, and date range. Do not infer precise figures from bar heights or pixels.
- Check that your SVG includes every important label. If labels are tiny, simplify the graphic or increase their size before conversion.
- Choose the PNG width for its actual placement, preview the result, and download it. A wider export adds pixels but does not fix unreadable design at the displayed size.
- Publish the PNG with a short alt and a real HTML table or equivalent text nearby. Transcribe the values from the source dataset, not from the raster image.
- After a data revision, update the SVG, PNG, takeaway, and table together. Compare every category, number, and unit against the same source.
When the SVG has no source data
Some charts are supplied as paths or shapes with no embedded numeric labels. In that case, the PNG can preserve the appearance but cannot establish the exact underlying values. Ask the chart owner for the dataset. If only the graphic survives, describe the visible trend without inventing precise measurements, and label any approximate reading as approximate.
A screenshot or converted PNG is not a substitute for a data table. If the data is sensitive, consider whether the table and chart should be published at all; conversion on this site's tool runs locally in the browser, but publishing the result is a separate decision.
Markup pattern
The table belongs in the page as HTML, not baked into the PNG. Replace these illustrative values with your own verified data.
<figure>
  <img src="weekly-tickets.png"
       alt="Support tickets peak in Week 2; exact counts follow in a table.">
  <figcaption>Illustrative support tickets by week.</figcaption>
</figure>
<table>
  <caption>Support tickets by week</caption>
  <thead><tr><th scope="col">Week</th><th scope="col">Tickets</th></tr></thead>
  <tbody><tr><th scope="row">1</th><td>12</td></tr>...</tbody>
</table>
For further guidance on complex-image alternatives, see the W3C WAI complex images tutorial. For the broader alt-text decision, read our accessible diagrams guide.
FAQ
Can a PNG store my chart's data table?
A PNG stores image pixels. Keep a separate dataset and publish its values as text or a table where the image appears.
Should the alt repeat every number?
Use a concise purpose or takeaway in the alt and place detailed values in the adjacent table. Avoid conflicting copies of the numbers.
Can I estimate exact values from bar heights?
No. A visual estimate is not the original data. Request the source figures before publishing an exact-value table.